

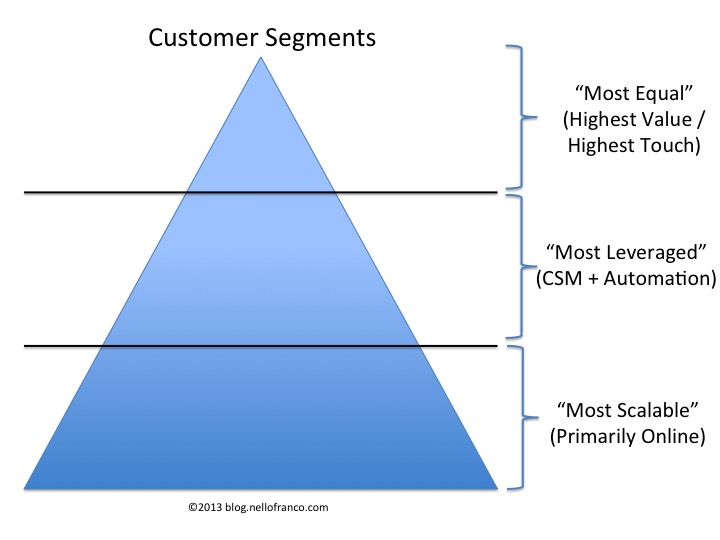
A few months ago I wrote a post about customer segmentation titled All Customers Are Equal, But Some Are More Equal Than Others. I graphically represented the concept of customer segments with a pyramid, because it was a simple and straightforward representation of the concept. When it comes down to actually segmenting your own customer base, though, and making decisions about how to service them, I’ve found the best way to do that is to use a Pareto Chart.
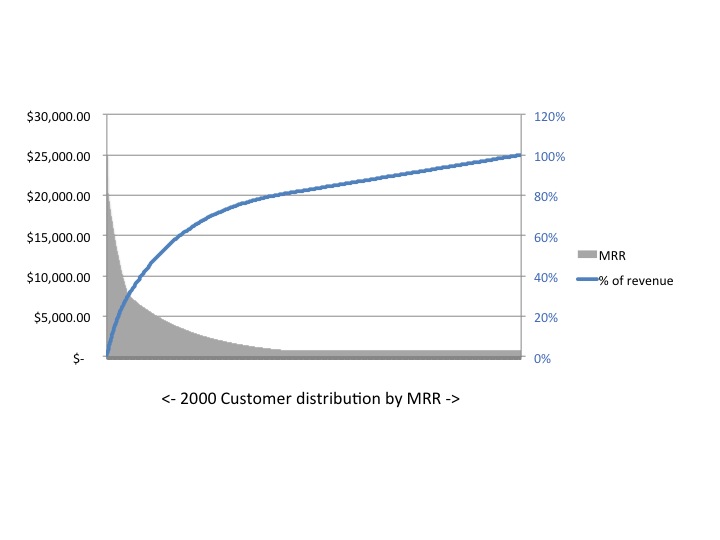
Figure 1: Pareto Chart of 2000 Hypothetical B2B Customers
The Chart Described
If you aren’t familiar with the concept, a Pareto Chart is great way to visualize how your revenue is distributed across your customer base and how much your largest customers contribute to your overall revenue.
The chart above came from a hypothetical set of 2,000 customers I created from data that I made-up to represent a typical B2B customer distribution curve. The grey portion of the Pareto Chart is actually a bar graph made up of 2000 data points in descending order. Each (very thin) bar represents a customer’s Monthly Recurring Revenue (MRR) and maps to the axis on the left – in MRR dollars.
The blue line shows the cumulative percentage of revenue represented by the customer base as it moves along the X axis and maps to the axis on the right – in percentage of total revenue.
Creating Your First Segment
The Pareto chart quickly shows you a couple of things:
- How your customers are distributed
- How many customers fall into each bucket so that you can efficiently allocate resources to manage a large percentage of your revenue base.
The image below takes this hypothetical (but not uncommon) B2B case and creates a first segment of customers. This segment happens to consist of approximately 10% of the customer base (It’s 200 grey “bars” wide, representing 10% of the 2000 bars in the graph) and approximately 45% of the revenue (the right edge of the green area intersects the blue “% of revenue” line at about 45%). You’ll also see that the MRR value at the right edge of the green area is approximately $5,000 – which represents the minimum MRR for a “Tier 1” customer. Again, these numbers are examples. The process for creating customer segments requires a little art to go with this science and is going to take some iterations to get right; however 10% of your customer base is a reasonable baseline number for a high-touch CSM organization. You may choose to make it larger or smaller for a number of reasons (which I’ll cover in a future post), but this framework is a good way to illustrate it and justify whether you’re covering a reasonable amount of your revenue base.
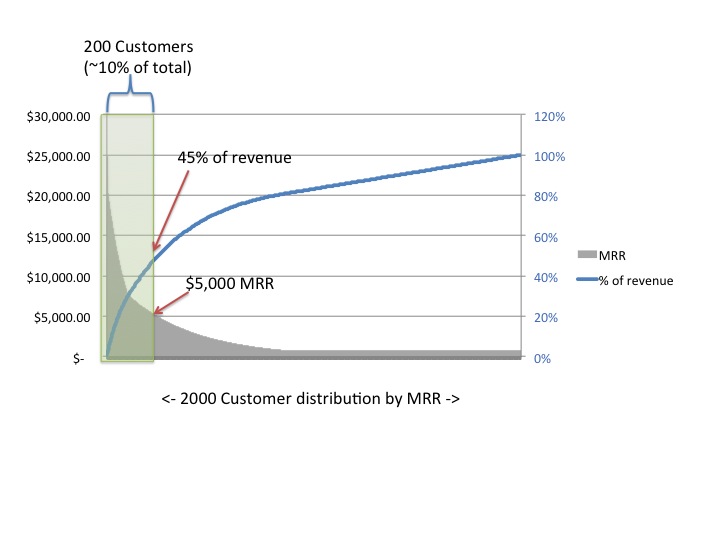
Figure 2: The First Segment
The Second Segment
Now that you’ve created a high-revenue customer segment that can justify a high-touch CSM, you might want to see whether it makes sense to cover another relatively small number of customers that still might represent significant revenue with a somewhat lower touch, but still personal, approach. Based on this customer distribution, you can see that a second segment can be created that consists of twice as many customers as the first segment, and in combination with the first segment gives you coverage for approximately 75% of monthly revenue.
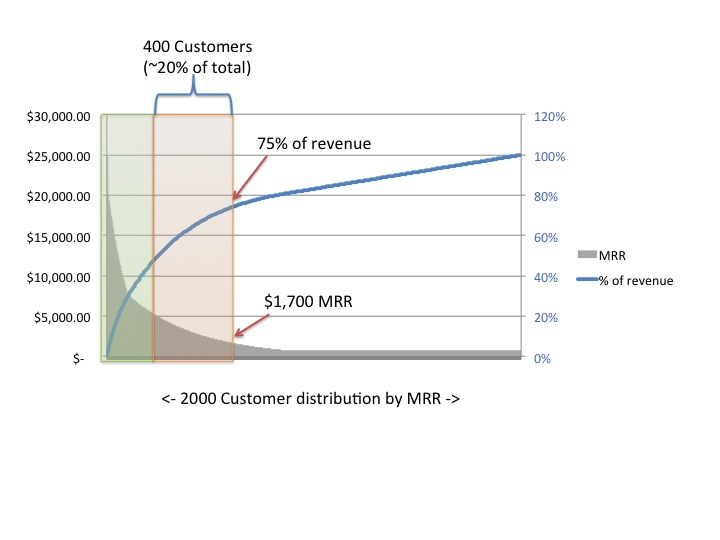
Figure 3: The Second Segment
Pareto Charts can illustrate pretty clearly how much revenue is represented by each segment of customer as well as show the baseline MRR that can be used to define the “floor” of each segment. Figure 3 shows that in this hypothetical situation, 75% of the revenue is represented by approximately 30% of the customer base, with an MRR of $1,700 and above.
So Now What?
Now that you have a framework for segmenting your customers, you can optimize your investment in your CSM function. In this example, the first segment of customers represents significant revenue that can justify high-touch named CSMs who can engage with customers in a personal, frequent, and customized manner. The second segment consists of roughly twice as many customers and a little over half the overall revenue of the first segment, so the amount of engagement per customer that can be justified for each CSM is significantly lower. The third segment represents approximately 3/4 of total customers yet only 1/4 of total revenue and can be effectively managed with Customer Success Automation and Marketing Automation. I’ll discuss how to address these three very different customer segments in more detail, and how Customer Success Automation applies across all three in a future post.


You must be logged in to post a comment.