
As the old saying goes: “You only have one chance to make a first impression”. If you want to increase the likelihood of success for the deployment and adoption of software, you need to make that first impression while your customer is still excited about their purchase decision. It holds true for enterprise software, B2C software, and everything in between, even though complexity and timeframes differ for each of those categories. In the world of SaaS, the post-sale journey to adoption and value can make or break a company.
So how do you effectively manage your deployments so that you’re: A) maintaining that momentum; and B) providing a quality customer experience that is helping them get a return on their investment in your solution? A great metric to use is Time To Value (TTV). Every solution is going to have it’s own onboarding process which can be as simple as an in-app wizard or as complex as a data integration and product configuration/customization project done by a Professional Services team. In either case, a reasonable target TTV should be measured in days or weeks (rather than months), depending on the complexity of the product and the onboarding process. Even for complex enterprise solutions, you should create a phased deployment where you can measure initial value in 4-6 weeks. Loss of momentum in an implementation can create an incredible amount of pain for enterprise software deployments. Too often, the perceived/expected value in an enterprise software deployment looks like the Gartner Hype Cycle where customers fall into the equivalent of the trough of disillusionment (and frustration) prior to seeing any value from their solution. There was a surprising amount of tolerance for this in the world of perpetual licenses. In the SaaS world, however, …not so much:
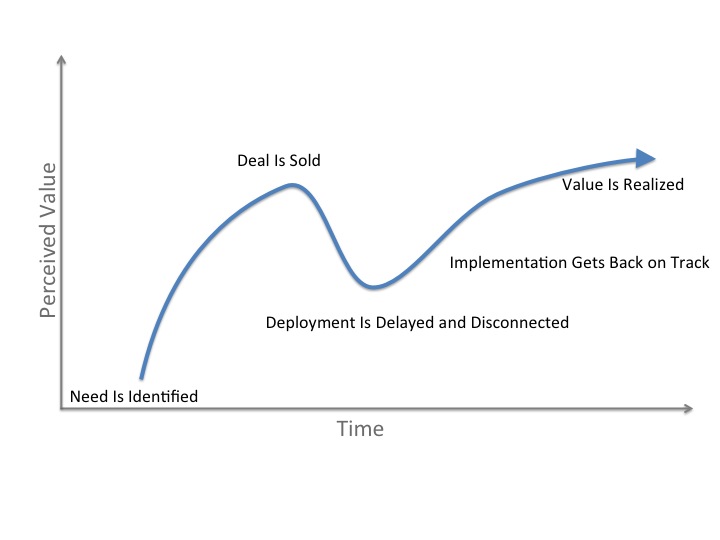
It should really be a much smoother and consistent curve of increased value demonstration (with aligned customer expectations) over time.

So how do you minimize time to value (TTV) for your customers, manage their expectations through the deployment cycle, and avoid the equivalent of the “trough of disillusionment”?
Step 1: Identify the unit of measure for value and set a quantifiable objective
Unless you define a “currency” by which you will measure value, you won’t know whether you’re delivering it. In some cases, adoption/usage may be used as a proxy, but to the extent that you can use a metric that your customer will use to measure the financial impact of your solution, start with that unit of measure. Examples for different types of solutions include:
- increased overall revenue
- larger basket size (for e-commerce transactions)
- higher customer lifetime value
- higher conversion rates
- quicker time to transaction
- lower cost per transaction
Even for a single given solution, different customers may measure value in different ways, so it’s important to connect with them to understand their specific objectives that will justify the time, effort, and funding they’re allocating to your solution. You’re getting their resources because you can solve a problem for them. Figure out how they’re justifying their investment in your solution and use the same currency to measure value.
Step 2: Identify the phases for delivering that value
Even if your solution can provide an order of magnitude return on investment, don’t try to get there all at once. Provide quick wins for your customers by phasing your deployment. Don’t try to deploy to the entire enterprise (or market) at once. Pick a department or small, logical group, where you can prove adoption and value, then continue to move forward with the additional momentum you’ve created from the internal user base you just identified. Your objective should be to get a customer advocate/thought leader to stand up in under 60 days and say “look at the value we’ve gotten from this solution. We need to roll this out to a broader group.” If your strategy is to land and expand, understand that you haven’t really landed until you’ve proven value.
Providing quick wins not only keeps the momentum going, but it also provides a healthy deployment model where you’re interacting with your customer on a frequent basis and continuously validating that you’re proceeding according to plan. Without frequent checkpoints, customer expectations and deployment realities can diverge quickly. The most common reason I’ve seen behind runaway or at-risk projects has been this disconnect between expectations and reality due to inadequate interaction and communication. The longer the time period between conceptual agreement and validation, the higher the likelihood that the end result will not be what the customer expected. Improving Time To Value will increase your chances of success.
Step 3: Execute and Manage(!) according to that plan.
This one might seem obvious, but execution is key. If deliverables aren’t met, understand why… and quickly. Break your implementation process into stages and understand which of the stages are creating friction/delays. In many cases, if you’re suffering from slow deployments, it’s primarily because of one or two key aspects of your implementation process, not all of them. Even in cases where the entire process needs work, by breaking it down into stages and seeing which of the stages are causing the biggest problems, you can quickly understand how to prioritize your activities around improving the deployment process. Customer Success requires constant iteration, listening, and learning from your customers.
In some cases, implementation delays are seemingly due to lack of responsiveness or loss of momentum on the part of your customers. Re-think this problem and see if there’s a way that you can restructure the deployment process so that you’re being more prescriptive for your customers and not requiring them to do things that take so much time and effort. I recently came across one example with a company that provided configuration options for custom reports in their new social analytics product. As part of their implementation process, they would ask customers to provide them with the top 4 items they wanted to see in their custom reports. Enterprise customers would iterate for weeks trying to get internal consensus on those 4 items, delaying the deployment, and delaying the time to value for customers. The solution: create 4 prescribed reports as defined by the implementation consultant, based on their knowledge of the customer as part of Phase 1 deployment; then allow the customer to modify those reports in Phase 2.
Good social networking and B2C companies really get the importance of Time To Value. They’ve sped up adoption and reduced time to value by implementing sign-up wizards as part of the enrollment process. By the time a new customer has finished creating a new account on Facebook, LinkedIn, or Instagram, they’ve been prompted to import contacts from their address book or other social networks in order to be positioned to get value immediately. In a previous life I ran deployments for an enterprise social networking technology and as part of our implementation process, we “bootstrapped” user accounts so that every user had profiles built on Day 1 that incorporated expertise from their previous 90 days of activity. Look at your implementation process to determine whether there are any similar opportunities to prescribe/recommend configuration options to your customers or speed system readiness for your customers.
Momentum is incredibly powerful. By optimizing your deployments for Time To Value, you can maintain, and even increase that momentum to create successful, loyal customer relationships. That, in turn, will lead to a shorter TTR (Time To Reference) …but that’s a whole other metric!


You must be logged in to post a comment.