
Whether you’re facing explosive growth or trying to manage your Cost of Services as you build out your customer facing organization, you know that you are going to be faced with real-world resource constraints as you fund and build a Customer Success function. And after all, you’re a responsible leader and this is 2013, so you know better than to just throw people at a problem. So how do you efficiently manage growth in a Customer Success organization while effectively empowering your customers?
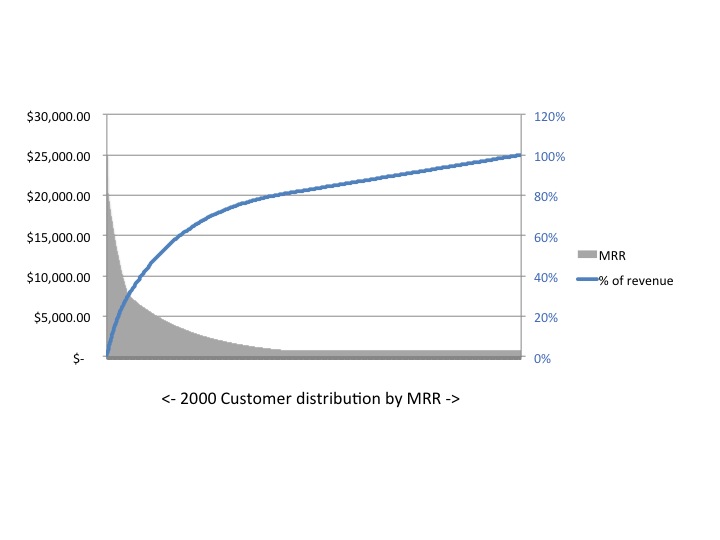
In my last post, A Practical View of Your Customers, I introduced an approach for understanding and mapping your customers by revenue using a Pareto chart. While I focused that article on how to look at your customer segments based on revenue, I’d like to focus this article on where to draw the line for each segment and why. If you haven’t read the previous post yet, I’d suggest doing so now. If you’re familiar with Pareto principles, my prior post certainly isn’t rocket science. You may still want to read it, though, as I’ll be re-using a chart I introduced there to illustrate my points.
Customer Segmentation and Engagement Models
The First, High-Touch Segment
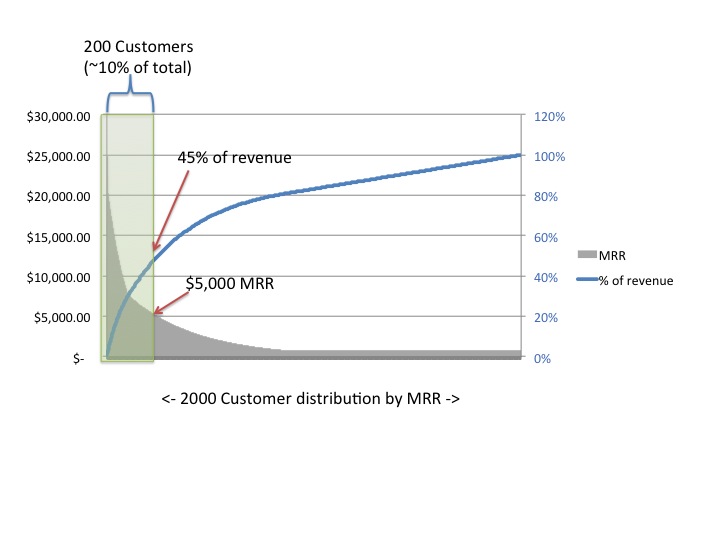
Unless your company is a rare blue unicorn and you have a completely homogeneous customer base, you’re going to have some distribution of current and potential revenue across that customer base. Creating a Pareto Chart will show you which of your customers make up the largest revenue contribution. While my hypothetical (but not uncommon) example in my previous post showed a top tier segment where 10% of the customers accounted for 45% of the revenue, your results may differ – possibly significantly. It is almost certain, however, that a minority of your customers will account for a majority of your revenue and very likely that a small tier will account for a significant percentage (greater than 30%). If this is the case, you have a great opportunity to create a premium service offering via Customer Success that will focus on retaining and growing those customers.
This tier of customers is incredibly valuable. You can afford to (and need to) provide them with some attention, and ensure that you have great two-way communication in place in order to both guide them as well as learn from them. If you’re in the early stages of building your Customer Success team, I’d suggest this first cut at determining how to build out this team:
- Think about the key activities that are required to ensure your top tier customers are getting value from your product
- Understand how much of a person’s time it will take to provide those activities
- Multiply that time by the number of customers you have in your top tier, and then staff accordingly, understanding that your CSMs will likely be able to spend less than 100% of their time on the activities you just defined
Note that this is a bit of an iterative process, and you’ll be doing a few “reality checks” as you understand how much time is needed for your customers – and as a consequence, how many people will be needed to deliver the experience you want your customers to have. There truly is a combination of art and science to this process, and if you can’t afford to hire enough resources to adequately service the group you’ve identified as your top tier, then you have three options:
- You can redefine and reduce the size of that tier then only expand it once you can adequately staff to support a larger number of top-tier customers;
- You can redefine (reduce) the level of service you provide to your top-tier customers; or
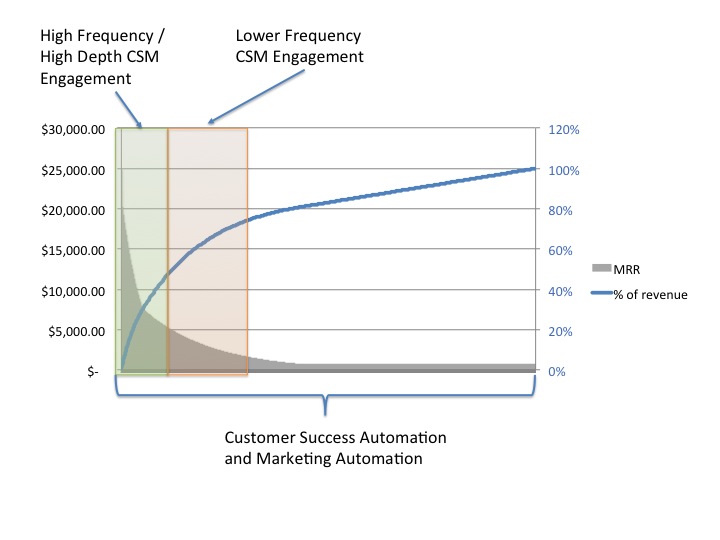
- You can introduce automation (customer success automation, marketing automation) to assist the CSM in managing the customer relationship
How much service and effort you provide to each customer is going to be specific to your offering. Once you’ve done your calculations, you’ll likely want to perform a reality check based on the Book of Business each CSM is projected to be responsible for. I’ve seen organizations where each CSM has a Book of Business of as little as $1M of annual recurring revenue and others where that number is closer to $10M… or more. Metrics and “standards” are still all over the map on this topic and are really dependent upon your industry and the level of service you need to provide to your customers. Early stage, highly-technical solutions will require more CSM effort than later stage “commodity” solutions. Whatever stage or solution you’re at, though, be sure that you’re creating a role that is going to be sufficiently engaged to help your customers achieve value.
A Second, Hybrid Segment (Optional, but likely)
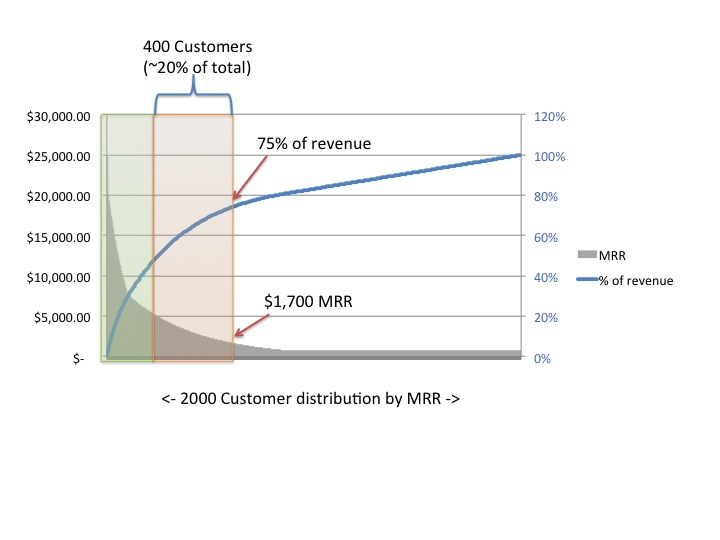
Depending on your customer distribution, you may want to define a second segment of customers who still represent significant revenue, but are probably closer to a 1:1 ratio of percentage of customers to percentage of revenue. In the hypothetical example I provide, the second customer segment represents 20% of the customers and 30% of the revenue. Again, your mileage may vary; however if you have a second tier of customers that makes up a sizeable percentage of your revenue, then you can (and probably should) identify a less intensive, but still personal, level of relationship with them (perhaps less frequent interaction than tier one and perhaps assisted even further by marketing automation). By doing this, you now have created personal relationships with two segments of customers that likely cover a majority of your revenue, but only a relatively small minority of your customers. My example in the last post shows 30% of customers representing 75% of revenue. While my example data is hypothetical, I’ve seen a number of companies within +/- 10% of these ratios, especially in the B2B space.
So how many CSMs should you assign to this space?
A good reality check for the number of CSMs to assign to this group is to use your Book of Business per CSM as the great equalizer. You may have CSMs in group 1 covering 10-15 customers and $3M in ARR. In Group 2, with smaller customers , a CSM might need to manage 50-75 customers to cover $3M in ARR. Automation will play a key role here to help identify customers in need, customers at risk, and to trigger targeted communications to customers at the right time.
The Third, Highly Automated Segment
While you’ve likely covered a majority of your revenue base in the first two segments, you still have a long tail (actually a very long tail in cases like freemium) of customers who are using your services but – at least for the time being – provide you with very little revenue. This customer segment is certainly important, both from a numbers, lead generation, and future revenue perspective; however you can’t afford to provide them with the same level of service you provide to customers who are paying orders of magnitude more than they are per month, so what does automation for this segment look like?
Whether this long tail represents 300 or 300,000 customers, you’re going to benefit greatly from an automation solution (or solutions) that help you:
- Identify customer usage patterns
- Identify at-risk customers
- Send appropriate communications to those customers based on behavior, triggers, or their lifecycle
- Keep your entire customer base engaged by helping you connect with them in a relevant way
While the long tail doesn’t represent a majority of your revenue, both this segment and your second segment are going to contain customers who represent incredible upsell opportunities – if you do some analysis that will help identify them. If you spend the extra effort up front, you can also leverage marketing automation to target relevant messages to those customers based on their behavior, activity, and other usage metrics.
If your strategy is to land and expand, you’ll need to look everywhere for the expansion opportunities, not just in the top tier. And if you’re using analytics, segmentation and automation appropriately, you can drive meaningful action with the right customers, whether they’re in your “top” tier or in your long tail.


You must be logged in to post a comment.